Sunday, September 30, 2007

3D Terrain Wood Carving

I found this image of a city model made in wood.

wood1

The model looks like it was made from a DEM, but I am not sure. The blog (Vector One: 3D Terrain Wood Carving) says that the model was shown at an InterGeo event and links to a German company's website (link).

The model is very cool indeed.

Lets not forget about Yahoo! Maps

In my last post, I compared the custom map facilities provided by Google and Microsoft in their online products. In this one I add my thoughts about Yahoo's custom map tool called MapMixer.

Now MapMixer doesn't seem to have the ability to add points, lines and polygons. So to do something like I did in Google Maps and Live Maps - create a list of RTD Light Rail Stations in Denver - doesn't seem possible in Yahoo! right now. On the other hand MapMixer allows you to very easily overlay your own imagery on their maps. Basically you upload your imagery - create 2 tie-points - provide some descriptions and you are done. So MapMixer allows you to create some very cool custom maps. But if you have seen my earlier post - not all imagery can be overlaid easily - and one doesn't always have custom imagery to make custom maps. So either Yahoo! is very quickly going to add the ability to define points, line and polygons or Google or MS might add the ability to add custom imagery overlays very soon in their products. (MS has a tool called MapCruncher that allows you to create tiles out of your custom imagery as well as use complex transformations to get your imagery to fit over theirs - but without them hosting the data - I don't see very many people using that tool.)


As for the data quality:

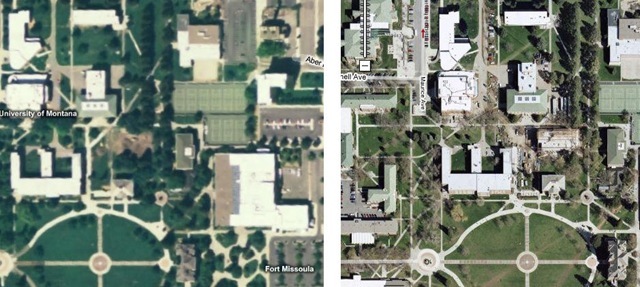
For the University of Montana, Missoula, Yahoo! has the latest imagery: The journalism building is complete. (In Microsoft the building is in its final stages of completion and in Google - the ground has been cleared but the building hasn't started yet). But Yahoo's imagery does not seem to be of the high-resolution that Microsoft has. (Google's imagery seems to be the lowest in quality of the 3 for Missoula).
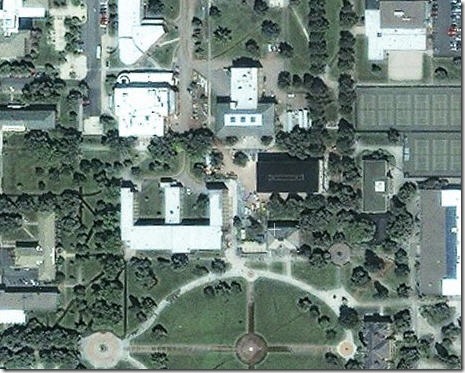
map1 Yahoo! Maps

                                          Google Maps                                                                                  Microsoft Live

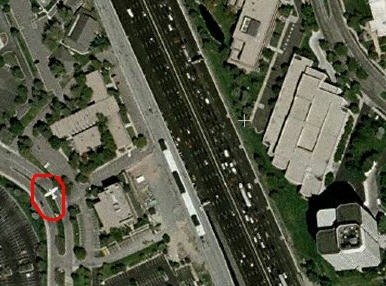
And when it comes to Denver here is Yahoo's imagery:
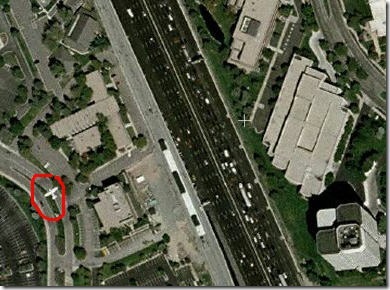
map2 (Check out the red circle - there is a plane in there!)

And here is Microsoft's and Google Map's respectively:
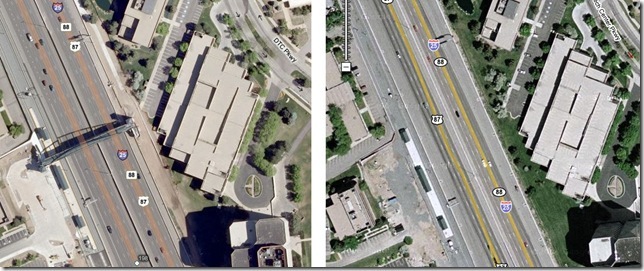
Microsoft wins hands down in having the latest imagery as well as the highest resolution imagery. (Yahoo and Google both seem to have captured their imagery at the same time - but Google's imagery is clearer).

Oh! btw, let me add a disclaimer here:
The evaluation of the imagery between the 3 providers (Microsoft, Yahoo and Google), is by no means scientific. It is completely qualitative and based on 2 areas that I have an interest in - Denver (where I live and hence use the maps to find locations everyday) and Missoula (where I studied, where my company is and so I check out the maps every now and then just for nostalgia). I know both of these locations well and hence by looking at the imagery can make a fair guess as to when it was taken by seeing what is there and not there (which is why you see the above 2 locations - in Denver the RTD stations were completed about a year ago - and in Missoula, the journalism building was also completed about a year ago).

Saturday, September 29, 2007

Creating custom maps in Microsoft's Live Maps and Google's Maps

After having created custom maps (RTD Light Rail stations) in both Microsoft's Live Maps and Google's Maps solution, here are some of my thoughts:

  map5 map4

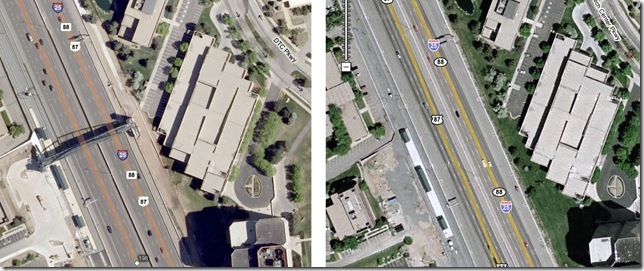
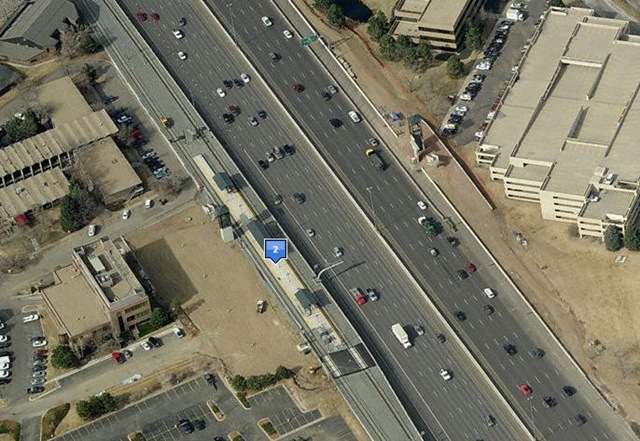
1. On an unconnected note to this topic Microsoft has higher resolution and newer imagery for the Denver area. (link) This made it a lot more easier to map the stations in Live Maps as the stations were present in MS's imagery (the bridge across the highway is part of the station which is not there in Google's imagery). The station shown below is the Belleview station and opened sometime in October of 2006, so Microsoft's imagery must be post October 2006 and Google's must be pre October 2006.

map3

link to above comparison: http://www.jonasson.org/maps/?lat=39.61409008931873&lng=-104.89550828933717&z=18

2. In Google custom maps are called My Maps. In Live Maps they are called collections.
3. Even though my example has only points representing RTD Light Rail Stations, both Live maps and Google maps allow one to also create lines and polygons.
4. Both Google and Microsoft allow you to share your custom maps. Though if you see this post of mine (link), you will see that Google allows you to embed their maps, which is a great feature. Live maps on the other hand only gives you a link and does not yet create the HTML code required to embed the map in a blog. (I am sure this will change soon).
5. Another nifty feature in Google Maps is that you can change your icons - Google has a collection that you can use, or alternatively you can even use your own custom icons. This will obviously make for cooler looking maps. On the other hand - Live Maps doesn't yet allow you to change icons.
6. I love the fact that you can view your maps in Live in a variety of views. Not just the traditional satellite, road and hybrid, but also bird's eye and 3D.
map6 Bird's Eye View
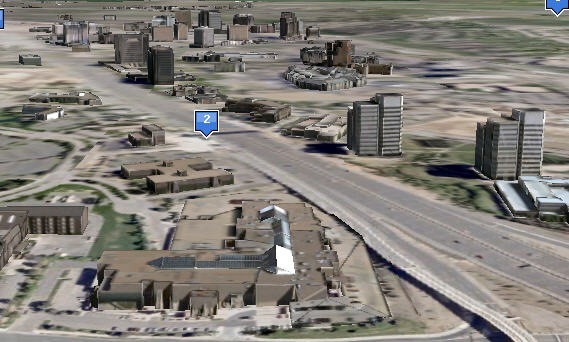
map7 3D View - with 3D buildings.

In conclusion:

Both Google Map's and Live Map's solutions are easy to use. They each have features that make them useful in their own ways (maps that can be embedded, custom icons for Google; bird's eye and 3D views in Live Maps). The fact that Live maps had higher res and more recent imagery made it a ton easier to map the locations, but I am sure there are other cities where Google has newer and better imagery - so I don't want to include that as a factor.

So both Google Maps and Live Maps are great ways to share custom maps. But because I have higher resolution imagery in Denver, I think I will be using Live Maps. Another factor that I love is the 3D view available within the browser.


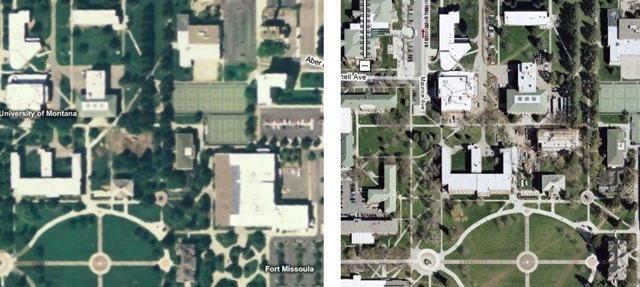
Above I have an example of a location where Live Maps has higher resolution imagery. Here is an example where Google Maps has higher resolution and newer imagery than Live Maps.

map8
http://www.jonasson.org/maps/?lat=46.861705914112164&lng=-113.98490309715271&z=17
(On the right is Google Maps and it shows the journalism building almost complete at the University of Montana, Missoula. In Virtual Earth, the ground seems to have been broken and the image looks like it was taken in spring).

RTD Light Rail Stations - Live Maps

map

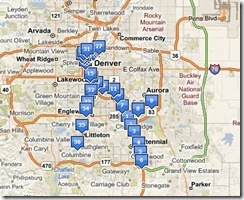
This is an example of RTD Light Rail Stations in Microsoft's Live Maps. (link)

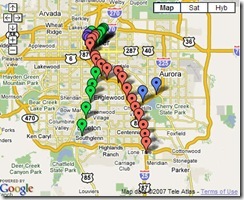
RTD Light Rail Station - Google My Maps

View Larger Map

Friday, September 28, 2007

India to set up satellite navigation system - The Economic Times

The Russians are restoring their satellite constellation for a global positioning system (GPS), called GLONASS. The Europeans are setting up their own GPS system - Galileo. The Chinese have the Beidou system. And now India is setting up their own regional GPS system called Indian Regional Navigation Satellite System (IRNSS) (link). The system is going to cost an estimated $400 million (INR 1,600 crores).

"We have already begun work on the system. It will be totally under our control. As part of the project, three satellites would be placed in the geo-synchronous transfer orbit, while the remaining four would be in geo-stationary orbit,"

My thoughts:

When all the systems are up there are going to be 24 Russian satellites, 30 European satellites 35 Chinese satellites, 7 Indian satellites and the original 24 from the US GPS system. Its going to be a crowded sky - just for the purpose of knowing where one is. I know because of their military uses, the chance that all these countries will decide and use a single system will never happen. But it would be cool if they all could inter-operate. That way I could take my Garmin or MIO, roam this planet and always know where I am! No where have I seen any chatter about this sort of an inter-operability..... so pinch me! time to wake up!

With GPS devices becoming ubiquitous, I wonder if there is a case for a commercial company that would provide a GPS signal through-out the world. Instead of a 100 satellites - the world would need only about 24 satellites. Or maybe a constellation of regional system?

Thursday, September 27, 2007

What is LiDAR?

Here is a nice summary of what LiDAR is :

LiDAR, which stands for Light Detection And Ranging, is a remote sensing system used to determine the elevation of an object on the ground. LiDAR data are used to produce highly detailed elevation or terrain models. Mounted on an aircraft, the LiDAR system is fully integrated with an airborne global positioning system (GPS) and inertial measurement unit to record hyper-accurate horizontal position and vertical elevation values of precise points on the ground.

- from the press release "GeoEye Announces MJ Harden's Purchase of Optech's Latest LiDAR Aerial Imaging System"

And here is a nice introduction from Optech's website: www.optech.ca/aboutlaser.htm

GeoEye purchases Optech's Latest LiDAR Aerial Imaging System

 GeoEye announced today that one of it's subsidiaries - MJ Harden, has purchased the latest LiDAR imaging system from Optech - called Gemini 167.

http://money.cnn.com/news/newsfeeds/articles/prnewswire/LATH08227092007-1.htm

Released less than a year back by Optech, the Gemini Airborne Laser Terrain Mapping (ALTM) system is a multi pulse system. It has the ability to operate at 167 kHz pulse repetition frequencies. Which means that one can get high pulse rates even from high altitudes. Higher pulse rates = more measured points on the terrain = higher accuracy in the terrain as well as extracted features.

The importance of the purchase for GeoEye is

MJ Harden is now able to merge imagery from their current digital mapping camera with LiDAR imagery to produce enhanced products ideally suited for large-scale mapping projects, such as mapping flood plains, coastal zones and public right of ways and corridors. This is especially important in the pipeline, oil and gas, mining, urban planning, disaster management, and utility and telecommunications industries.

Here are more specs about the Gemini 167 system: http://www.optech.ca/pdf/Gemini167.pdf

The important features in my opinion about this ALTM system - as far as feature extraction go are:

Laser repetition rate 33 - 167 kHz : Lower point spacing/Higher points per square area means more definition in data which in turn allows for extraction and modeling of smaller features on the terrain.
Operating altitude 80 to 4,000 m (higher altitude optional) : Ability to operate at higher altitudes is important especially in hostile environments (Army) and the ability to operate a low altitudes is important for power line corridors as well as capturing dense urban environments.
Horizontal accuracy 1/11,000 x altitude; ±1-sigma* : More accurate models.
Elevation accuracy 5 - 10 cm typical; ±1-sigma : More accurate models.
Range capture Up to 4 range measurements for each pulse, including last : The more number of measurements possible - the better one can model vegetation - such as forests. Typically in urban environments the multiple measurements don't provide very much of an additional advantage.
Intensity capture 4 intensity readings with 12-bit dynamic range for each measurement: Intensity values can be used to determine target material type, as well as for extraction in Feature Analyst.
Spot distribution Sawtooth, uniform spot spacing across 96% of scan: This is important for reliable feature extraction, as well as uniform accuracy.
Swath width Variable from 0 to 0.93 x altitude (m): More important from a cost perspective as higher swath widths allow for fewer flight lines. Less flight time = less money for the acquisition of the data.
Beam divergence Dual divergence 0.15/0.25 mrad or nominal (1/e full angle) 0.80 mrad:

LIDAR Analyst 4.2 Released

Version 4.2 of LIDAR Analyst was released today for the ArcGIS platform.

The biggest new feature is the ability to process your LIDAR tiles in batch. The implementation itself is unique and similar to the way in which batch is implemented for Feature Analyst. You first run through your extraction for one tile which is representative of all the other tiles that you wish to process as a batch. As you run through the extraction manually - all your custom settings are stored to a model file. You then launch the Batch Processing dialog, specify the model file, set all the input tiles and start the extraction process. You can then go home, take a coffee break or whatever - depending on the size and number of tiles - after a while you will have a folder hierarchy of your extracted results. As simple as that!

Some of the other exciting new features that we added are - an export to Google Earth (KML) command and an Extract Contours command. The API was also improved as well as many of the underlying algorithms, etc - which should allow you to process data-sets with better accuracy and higher speeds.

Below is the Press release:


VLS Releases LIDAR Analyst 4.2

VLS is pleased to announce the new release of LIDAR Analyst® 4.2 for ArcGIS. A free trial version of the software with tutorial is available at www.lidaranalyst.com.

LIDAR Analyst generated world-wide acclaim for radically simplifying the collection of 3D GIS features, such as buildings and terrain. Now, important new tools and capabilities are added with the release of LIDAR Analyst 4.2, including:

  • Batch processing of multiple LiDAR data files
  • Direct export of 3D buildings to Google Earth
  • Enhanced DEM generation and editing
  • Additional contour and attribution tools for terrain and vegetation features
  • Control point analysis to compare extracted elevation values to ground truth control points
  • Ability to assign a coordinate system to LAS files
  • A convert LAS file to raster tool
  • Optimizations for all underlying algorithms


For more information, contact VLS at sales@vls-inc.com or visit www.vls-inc.com.

VLS is a wholly owned subsidiary of Overwatch Systems.

Tuesday, September 25, 2007

Autodesk is going to contribute a new coordinate system software to the open source community

Today - Autodesk's press release has garnered a lot of press - appearing in news articles, blogs and even Google Finance. Read it at GisCafe.

Something that intrigued me was in a field that already has two excellent solution - GDAL's OGR as well as Proj4 (OGR is built on top of Proj4), what more is Autodesk's solution going to provide.

According to Frank Warmerdam - the developer of GDAL

"The latest planned contribution supports the projections and transformations necessary to support over 3,000 coordinate systems worldwide and has capabilities not previously available to the open source community."

The new offering from Autodesk seems to come from Mentor Software - from whom they seem to have acquired the software. Mentor Software was founded by Norm Olsen - a GIS guy with a lot of knowledge about projections, transformations and GIS systems. He has developed all the GIS software products at Mentor. Even before the days of blogs - Norm used to write regular articles on projections and transformation and also has a very informative forum (the forum has been dormant though). His company also has some freeware GIS tools.


I think that the software that Autodesk is going to be releasing is Mentor Software's CS-MAP. Tralaine another product from Mentor seems to be based on CS-Map and it boasts of fast conversion rates (35,000 per second) and (http://www.mentorsoftwareinc.com/products/traldll.htm - though on CSMap's specs it says 800). Also as it performs its calculations using double values - it  claims to be highly accurate.

CSMap specs: http://www.mentorsoftwareinc.com/PRODUCTS/csmap.htm

Tralaine specs: http://www.mentorsoftwareinc.com/products/traldll.htm

One of the important points that will affect how well the new Autodesk code is going to be adopted by GIS software developers is the license that it is going to be released under. OGR is released under the terms of the MIT License - which makes it easy to use in all sorts of products - commercial as well as open source - which is why it's adoption has been so wide-spread. It is my hope that Autodesk does the same - so that both commercial and non-commercial products can leverage it - especially if it does provide the accuracy and speed that it says it will. (I truly hope that they don't use GPL which is so restrictive - from a commercial adopters view point). A good piece of news on this end is that Autodesk released MapGuide under the LGPL license - which I think is open enough for those developing commercial apps to include it in their software.


The software is scheduled to be released to the Open Source community by the end of 2007.