
Showing posts with label LIDAR. Show all posts
Showing posts with label LIDAR. Show all posts
Thursday, May 06, 2010

Sunday, March 21, 2010

Saturday, January 30, 2010
LIDAR Mashup – a web-service, SilverLight version of Bing maps and Video
Here is an interesting use of LIDAR done by the folks at CadMaps
It uses a web-service to retrieve LIDAR data as a profile image (Webservice is LIDARServer a product from QCoherent). The images were then made into a video and then displayed in the SilverLight version of Bing Maps. What is very cool is the way in which they managed to get the video to sync with the path of the video in Bing Maps.
Implementation information: http://www.cadmaps.com/gisblog/?p=387
Bing Maps mashup: http://etl.onterrasys.com/OnTerra_MACCorridor/
Thursday, November 19, 2009
Free LIDAR training from ESRI
ESRI is offering its online LIDAR training for ArcGIS for free. Check it out at - http://training.esri.com/acb2000/showdetl.cfm?DID=6&Product_ID=945
The overview on page states:
This seminar introduces lidar in general, discusses how to manage lidar data using ArcGIS, and also addresses the needs of those who would like to know the benefits of using lidar data in ArcGIS.
Lidar datasets are massive and contain three-dimensional spatial information about features such as buildings, trees, power lines, etc. Lidar datasets are raw point cloud formats that are not easily interpreted. ArcGIS Spatial Analyst and ArcGIS 3D Analyst provide the functionality and tools you need to represent and extract feature information from lidar data.
The presenter will discuss:
- Introduction to lidar
- Understanding and interpreting lidar data using ArcGIS
- Lidar applications and derived products using ArcGIS
Monday, January 12, 2009
LIDAR Data Viewers – LP Viewer

Today, QCoherent released its free stand-alone version point cloud viewer, called LP Viewer (link).


The viewer is fast and allows you multiple ways to navigate through the point cloud. Boxes and cursors (an airplane) show you at all times, where in the frame you are, making it difficult to get lost in space (a constant problem I had with LAS Edit).
The viewer also allows you to view the point cloud as a solid surface (tinning).
In every view, I never felt like the viewer got bogged down with the point cloud. (I did not try it with a large point cloud – I used the toronto core data-set from Optech).
The viewer also allows you to view the classified point cloud. This I think is an extremely important feature – because it allows you to perform QA/QC on your classified data (manual or automated).
The following screen shot shows the Toronto point cloud with a solid surface (TINNED). The point cloud was classified using VLS’s automated feature extraction software LIDAR Analyst. The screen shot is remarkable for 2 reasons – it shows how accurate the automated classifier in LIDAR Analyst is and how well LP Viewer allows you to visualize the data.

(red – buildings, brown – ground, green – trees)
Drawbacks? For a first release, free viewer – there are none. The viewer does everything one would want from a 3D point cloud viewer. The only issues I had was a crash of my display driver on my Vista machine (which might have been a random occurrence – because it hasn't occurred since). The one thing that I do miss is that in the 3D view, when you rotate the TINned point cloud, during the rotation it switches to the point cloud view – I wish this could be controlled via a switch.
But, tonite, I can go and delete the old installer for LASEdit, and replace it with the LP Viewer installer.
note: other tools such as Isenburg’s tools also exist, but I never had a chance to use them more than just a quick evaluation.
disclaimer: I was the lead engineer for LIDAR Analyst from 2004 to 2008. It still seems to be the best automated feature extraction software for LIDAR data.
Wednesday, October 01, 2008
Universities of Florida and Berkeley receive $4 million grant to continue mapping with lasers
The National Science Foundation recently awarded a five-year $4 million renewal grant to researchers at the University of Florida and the University of California at Berkeley for the National Center for Airborne Laser Mapping, known as NCALM.
UF was the first university in the nation to purchase and operate a survey-grade airborne LIDAR system in 1998. Researchers mounted the system in a Cessna 337 at Gainesville’s airport. Pumping out 5,000 laser pulses a second, they mapped beaches, marshes, flood zones, sink holes, highways and forests in Florida and nearby states.
via UFL.edu
The NCALM authored this good introductory article on laser scanning - http://ptonline.aip.org/journals/doc/PHTOAD-ft/vol_60/iss_12/41_1.shtml (published in Physics Today)
Home
SkEyes Unlimited designs, integrates, and commercializes off-the-shelf LADAR systems for colorized three-dimensional terrain mapping, stabilized wide field-of-view cameras for situational awareness and teleoperation safety, and autonomous planning, navigation, and control systems for unmanned aerial vehicles.

Found via: http://www.popcitymedia.com/timnews/Skeyes1001.aspx
Working in a university basement lab and a workshop in Zelienople, SkEyes Unlimited has developed a Box, Cam and Laser that has the potential to help with search and rescue missions, terrorist attack surveillance, even national defense. The Box is a state-of-the-art laser detection and ranging system. Mounted under an unmanned 7-foot helicopter, a Yamaha RMAX, it flies the helicopter while mapping the terrain below to within two to three inches of accuracy.
At $400,000 each for the Box, “they aren’t flying off the shelf,” says Omead Amidi, the lead researcher, co-founder and a research faculty advisor at The Robotics Institute. Japan has purchased several for construction site monitoring and disaster assessment and the U.S. Dept. of Defense has purchased three. The purchases are helping to keep the company going while research to bring down the price is ongoing.
Interesting papers by Skeyes:
Determining the transformation between the sensor’s coordinate frame and the robot’s reference frame. (link)
Change detection using a video camera. (link)
Friday, September 26, 2008
Best practices for working with DEMs
 A good article from ESRI’s mapping center on best practices for working with raster elevation data-sets (DEMs). Mapping Center.
- Manage DEMs in their native geographic coordinate system
- Standardize names of your DEM files so that it is easy to determine units and point spacing
- Always keep an original copy of the DEM .in the original geographic coordinate system. Use this to create any derived data-sets in a new projected coordinate system.
Some points that I would add:
- Get your provider to provide you with meta-data about the DEM data-set. One of the most important pieces of information that you should get is the point spacing that was used to capture the data-set. Knowing what the point spacing was, allows you to determine what sort of work you can do with the DEM. (eg: you cannot get buildings out of DEM that was captured with a point spacing of 2 meters).
- When creating tiles – try and cut the tiles such that they are homogenous in the kind of features that they contain:
eg: don't cut a tile such that one portion contains an urban center and the other contains mountainous terrain or dense forests. This is because when you perform geo-spatial analysis – extracting features will become difficult as you will need to use different settings on these different types of geographic features. - If you are going to get elevation data – then try and get it with the original point cloud. Having the original data from which the DEM was created will allow you to use the widest set of tools for processing your data. (Also, most new algorithms that come out are based on processing point clouds as they have a lot more precision).
But remember, just because you have a DEM, or you are using a raster based algorithm for feature extraction – you aren’t working with less precise data. Precision in derived data from your elevation datasets is based on the features you are trying to extract. (eg: bare-earth and most building footprints can be extracted from DEMs with a comparable precision to that of bare-earth and building footprints extracted from point clouds).
LIDAR Analyst has proved time and again in many studies – that you can have a high degree of precision and accuracy when processing and extracting features from DEMs. - If you are getting new data – attempt to get the lowest point spacing that you can afford. Even if you dont need it for your current application. I have seen many times where organizations get lower resolution data which is cheaper and maybe sufficient for the current work that they are doing, but useless a year later when they try to use the data for some other purpose. (Most often the case is that LIDAR data was acquired for performing flood modeling for which 2 meter point spacing or higher can work, and later when they try to extract building foot-prints – the data is pretty much useless except for the larger buildings).
- Learn to setup your DEM for visualization with a hill-shade layer in traditional GIS applications. (In ArcGIS, this involves setting the DEM layer to have a transparency and has a hill-shade layer below it). This can make a world of difference in being able to differentiate and find objects visually.
QCoherent Software announces the release of LP360/Classify Version 1.6
 QCoherent Software, announced the release of LP360 v1.6 and LP360 Classify v1.6 today.
New features in LP360 v1.6 include:
- LAS 1.2 Support
- Enhanced Export Features
- Quick Display Filters and Copy Legend Options
- Draped Profile Lines by Point Source (flight line) attribute
- Integrated ArcGIS Breakline Digitizing tools
- On-The-Fly Topology Corrections for Breaklines
http://www.qcoherent.com/news20080926.htm
If you process large amounts of LIDAR data then in my opinion I think you should have both LIDAR Analyst and LP360 in your tool-belt.
 LIDAR Analyst provides you with automated tools to perform classification on large elevation data-sets (both point clouds and DEMs). But as we all know - any automated tool, will make mistakes. It is for those cases that a tool such as LP360 becomes extremely useful. As an interactive editing and QA/QC tool - LP360 is one of the best I have seen. It handles the display of really huge point cloud efficiently and provides you with an awesome set of tools that allow you to leverage your classified data (that LIDAR Analyst output).
And now with the release of LPObjectsT (their API into LP360), you can create new tools that use both LIDAR Analyst features (through the Feature Analyst API) and LP360 features using their new API.
Wednesday, September 10, 2008
LIDAR saves the day in Iowa
Link | The Des Moines Register
You may have never heard of the National Geospatial-Intelligence Agency, a Department of Defense combat support agency and member of the national Intelligence Community. But this agency is considered the "eyes of the nation" and uses technologies, including Light Detection and Ranging technology, or LiDar, to gather information that can be used to prepare for and respond to terrorist threats and disasters.
...in 2005, after Des Moines hosted the National Governors Association's meeting, a disk with some of the data was given to government officials in Iowa. It contained information about buildings, trees, forests and topography.
When the Des Moines River threatened Johnston this summer, Croll was out surveying a residential area to determine where water might hit.
"An intern with me said, 'Why couldn't you just use some of that LiDar data we got?'" Croll said."Instead of taking sandbags to 15 houses, we took them to one," he said. "It was incredibly accurate" in predicting where flooding would occur. He has since used the information for a tree inventory in the city.
Sunday, July 27, 2008
Overwatch to Host Free Software Training At ESRI User Conference
 Overwatch Geospatial Systems, an operating unit of Textron Systems, a Textron Inc. (NYSE: TXT) company, will provide free geospatial data production training for “Building 3-D City Models from Imagery and LIDAR.” The training is scheduled for Friday, August 8, 2008 at San Diego State University and space is limited to the first 20 registered attendees.
The training will develop feature extraction skills to build, analyze and publish a 3D city model from satellite imagery and airborne LIDAR data using the Feature Analyst®, LIDAR Analyst® and Urban Analyst™ software. Seats are limited, and registration is needed prior to attendance. Those who would like more information can email Marilyn Lee at mlee@overwatch.textron.com.
Overwatch Geospatial Systems will also host a user group meeting on Wednesday, August 6, 2008 from 1:00 to 2:30 p.m. in room 23 C of the San Diego Convention Center. The meeting will showcase feature extraction projects using the Feature Analyst, LIDAR Analyst and Urban Analyst software as well as preview new tools planned of the 5.0 release. Attendees are welcome to bring questions and provide input during the session.
Sunday, July 20, 2008
First LIDAR Music Video - RADIOHEAD - HOUSE OF CARDS
The latest music video by RadioHead was made with LIDAR data. They used the mobile Velodyne system for the portions that show complete environments. For 3D plots of the singers a system from GeoMetric Informatics was used. The Velodyne system was the same system used by the top 2 robot cars in the DARPA Urban challenge (link).
And if you don't know what LIDAR is - it stands for LIght Detection And Ranging. It works on a similar principle as RADAR and SONAR, except instead of radio waves or sound waves - it uses light to determine distance between the sensor and the reflecting surface. And as it is using light (typically lasers), it has a very high resolution.

In what is probably a first for a music group, RadioHead has open sourced their 3D data used in the video. Check it out at RA DIOHEA_D / HOU SE OF_C ARDS - Google Code
The making of the video, video has some in-sights into the technology used.
Finally, as you can see from the video - LIDAR data is just a point cloud. It is too fragmented and abstract to be of any real use without any sort of post-processing.
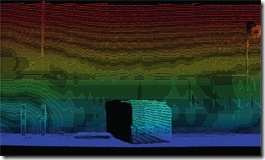
VLS is currently developing the Urban 3D modeling toolkit that will allow one to extract 3D models from point clouds such as those collected by the Velodyne system. (Shameless self plug - I was the lead engineer on the LIDAR based automated feature extraction software that VLS is working on). Keep track of the VLS website to see when they release a commercial version of the tool-kit which will allow you to go from point cloud to fully rendered 3D models with just a click.
And as always there is always the trusty old LIDAR Analyst application that can be used to make sense of 3D point clouds extracted from airborne vehicles.
Also here is a good article that goes into the latest advancements in LIDAR and features that you might see in a future version of LIDAR Analyst. Imaging Notes Magazine - LiDAR Advances & Challenges
And here is one of the papers that I co-authored on AFE from terrestrial LIDAR systems. AUTOMATED 3-D FEATURE EXTRACTION FROM TERRESTRIAL AND AIRBORNE
As a final thought - I never expected to see a video completely made with 3D point cloud data, at least not as early as this RadioHead video. Very cool!
Thursday, June 26, 2008
Visualizing DEMs in ArcGIS using LIDAR Analyst
I uploaded 2 videos to YouTube today that was in response to question from a user of LIDAR Analyst.
They describe how to set up visualization of the DEM and Bare-Earth DEM in ArcGIS. Instead of the default option of creating a RGB hill-shade raster this technique keeps the DEM and Hill-Shade rasters separate.
There are two major reasons that I prefer this method (instead of the RGB raster):
1. You can customize the coloring. This allows you to choose a color ramp that brings out the details in your DEM.
 DEM without hill-shade - looks flat and it is hard to make out features


Above: DEMs colored using 3 different ranges with hill-shade rasters providing a psuedo 3D look - making it easier to see detail. (Color changes was done by simply changing the color-range associated with the symbology of the DEM raster).
2. You can query the DEM's elevation values. (With the default option - you will only get the RGB values).
 Querying of the default hill-shade raster doesn't allow you to determine elevation values because the hill-shade raster is a RGB image.
 Querying of elevation values is possible, when DEM and hill-shade are kept separate.
Obviously the downside is that - you cannot get the colored visualization in other GIS applications. (So if you want to view the hill-shade in Imagine, you should output to one of the other options).
Visualization of DEMs in ArcGIS - shows you the technique for visualizing any DEM raster.
Visualization of Bare-Earth DEMs is basically the same steps as shown above, except shows the colors that make most sense for bare-earth DEMs.
The bare-earth was automatically extracted using LIDAR Analyst for ArcGIS. Hill-Shade rasters were created using LIDAR Analyst.
Friday, June 20, 2008
LIDAR Analyst
Here is an article that talks about the stuff that I work on - software that aids in automated feature extraction from LIDAR data. (This is in addition to my work with Feature Analyst, which aids in automated feature extraction from EO imagery).
In his ILMF presentation on feature extraction from LiDAR data, Overwatch Textron Systems’ Chief Operating Officer Stuart Blundell observed, "Software development is always chasing after advances in sensor capability." He is dedicated to resolving the specific requirements of LiDAR in three areas that create bottlenecks during the feature extraction process:
- The use of multiple sensors during acquisition;
- The merging of RGB color data or intensity data with XYZ data points;
- High spatial resolutions and very large datasets.
Logjams result when the software chokes while trying to accommodate all of these characteristics of LiDAR. According to Blundell, they are most likely to occur at the data registration stage, during feature extraction, or when attributes are applied to the data so it can be useful in a GIS database. If LiDAR data can be manipulated in a way that aligns with GIS-ready vector or shapefile formats, mapping experts should be able to move beyond the mere visualization of a scene and into the extraction of smaller physical features from within that scene. See Figures 4 and 5.


Figure 4a - The first image shows a 7x7-kilometer tile of airborne LiDAR collected over Denver, Colo. The LiDAR data has been Hill Shaded using LiDAR Analyst software to support the visualization of the data. Higher elevations are in white colors and lower elevations in green.
Figure 4b - The second image shows the Bare Earth grid automatically extracted from the LiDAR using LiDAR Analyst. The Bare Earth is used to support terrain analysis.

Figure 4c (below) - The third image is the building footprints that are automatically extracted by LiDAR Analyst as 3D Shapefiles. LiDAR Analyst extracts simple, multi-component and complex 3D buildings from LiDAR. These 3D Shapefiles include 18 different geometric and descriptive attributes for each building such as maximum height above ground, roof type and area.
- LiDAR Analyst is an Overwatch Textron Systems software product designed in 2004 to provide this functionality as a plug-in for ArcGIS and ERDAS Imagine. It will be available in 2008 as a plug-in for Remote View and ELT.
Blundell also emphasizes the importance of file specification standards in software design, and lauds the work that has been completed in this area by the LiDAR Committee of the American Society for Photogrammetry and Remote Sensing. "If people are using LAS (LiDAR Data Exchange Format) standards for LiDAR, regardless of the size of the dataset, that’s standardized in a way that we can interpret information about the spatial resolution and that kind of thing," he says.
The LAS 1.0 specification already is widely accepted in the industry. An update, LAS 1.1, incorporated features that allowed for more robust point marking. LiDAR committee member Lewis Graham represents LAS 1.1 as an interim update that remedies problems in the 1.0 specification, such as limitations in the encoding of flight line numbers. He expects the LAS 2.0 standard to be a major revision, with accommodations for more comprehensive encoding of terrain modeling and for emerging technologies such as waveform digitization.


Figures 5a, 5b, 5c & 5d - This series from Overwatch Textron Systems shows feature extraction for identifying a dumpster.
Read the entire article at Imaging Notes Magazine - LiDAR Advances & Challenges
Google Maps Car Busted - Flickr

Picture of a Google StreetView car pulled over by a cop in San Francisco. (from Flickr).
What is interesting is that it gives us a close up look at laser sensors that Google has added to its StreetView sensor platform.


I had written about the new laser sensors that were first seen on Google cars trolling the streets of Europe (Google collecting 3D data). This platform looks identical to the one spotted in Milan.

With the new angles that these images provide - it looks like there are 4 SICK laser sensors mounted on this platform. Two that are oriented to scan vertically and pointed to look on either side of the car and the other two facing front and back of the car are oriented to scan horizontally.
This is different from the setup that Zakhor and Frueh used, where they had two SICK lasers facing the same direction, with one scanning horizontally and the other scanning vertically.


(from http://www-video.eecs.berkeley.edu/papers/frueh/siggraph2003.pdf, the image on the right shows the 2 scanners oriented so that one is capturing vertically - red and other horizontally - peach)
Here is another vehicle developed by a Japanese university that uses 3 scanners. (link)

Here is a great article on the SICK laser with pictures of what the inards of this gadget look like (Link).
And here is what it does
This is a time-of-flight type LIDAR, which means that it literally uses the speed of light to measure distance. A laser sends out a pulse of light, and a timer is started. The timer stops when the pulse's reflection is detected. Distance is simply T/2C, where T is the timer delay and C is the speed of light. If you rotate the entire optical assembly (or just a mirror in this case), you get very detailed polar range data.
Finally, here is some more information on the SICK laser (link)
And a project that uses the SICK laser for range detection using Microsoft's Robotics Studio (link)
Monday, June 16, 2008
Flash LIDAR
RIT scientist Donald Figer and his team are developing a new type of detector that uses LIDAR (LIght Detection and Ranging), a technique similar to radar, but which uses light instead of radio waves to measure distances. The project will deliver a new generation of optical/ultraviolet imaging LIDAR detectors that will significantly extend NASA science capabilities for planetary applications by providing 3-D location information for planetary surfaces and a wider range of coverage than the single-pixel detectors currently combined with LIDAR.
The device will consist of a 2-D continuous array of light sensing elements connected to high-speed circuits. The $547,000 NASA-funded program also includes a potential $589,000 phase for fabrication and testing.
The device will consist of an array of sensors hybridized to a high-speed readout circuit to enable robust performance in space. The radiation-hard detector will capture high-resolution images and consume low amounts of power.
The imaging component of the new detector will capture swaths of entire scenes where the laser beam travels. In contrast, today’s LIDAR systems rely upon a single pixel design, limiting how much and how fast information can be captured.
“You would have to move your one pixel across a scene to build up an image,” Figer says. “That’s the state of the art of LIDAR right now. That’s what is flying on spacecraft now, looking down on Earth to get topographical information and on instruments flying around other planets.”
The LIDAR imaging detector will be able to distinguish topographical details that differ in height by as little as one centimeter. This is an improvement in a technology that conflates objects less than one meter in relative height. LIDAR used today could confuse a boulder for a pebble, an important detail when landing a spacecraft.
Friday, May 16, 2008
3D Flash LIDAR Vision for Robots
YouTube - 3D Flash LIDAR Vision for Robots, UAVs, UGVs
Example of a flash LIDAR system being used on a robot by iRobot.
Sunday, April 06, 2008
LIDAR in India
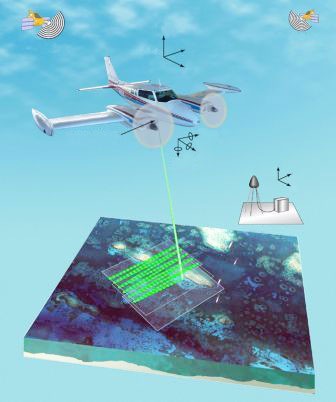
Here is a recent news article on how India plans to use LIDAR technology in The Telegraph - Calcutta (Laser Light on Terror)
Airborne Altimetric LiDAR Where does India stand?
The Indian Institute of Technology at Kanpur (IIT-K), seems to be at the fore-front of LIDAR research in India. Here are some links from that organization.
IIT Kanpur page on LIDAR: http://home.iitk.ac.in/~blohani/: Dr. Bharat Lohani is part of the Civil Engineering department at IIT-K and does most of the research into LIDAR.
International School on LiDAR Technology: http://home.iitk.ac.in/~blohani/LiDARSchool2008/index.html : A workshop on LIDAR that is currently in progress at IIT-K. This is the workshop that the news article from "The Telegraph - Calcutta" references.
LAS Convertor : A convertor utility that allows you to move between LAS formats as well as to ASCII.
Limulator : LIDAR data capture simulator. The simulator generates LiDAR data similar to a real LiDAR sensor for further display and analysis
Shameless self-plug:
LIDAR Analyst : The LIDAR tool created by my group at VLS for automated feature extraction from LIDAR data. www.LidarAnalyst.com
Tuesday, March 04, 2008
Google Cities in 3D Program
via Got 3D data- and DirectionsMag
Google solicits building model data from local governments via its "Google Cities in 3D Program". Google advertises the program as a means for government to share its data with other stake-holders as well as the general public.
If you have LIDAR data for your city then you must give LIDAR Analyst a try. LIDAR Analyst not only can extract your buildings but will also export it to KML files - which can then be provided to other users either through the "Google Cities in 3D Program" or via your own website. In addition you can also provide Google with your bare-earth DEMs, as well as tree and forest layers that you extracted using LIDAR Analyst.
Here is what Google has to say about the data formats that they will accept towards this program. (http://earth.google.com/support/bin/answer.py?answer=90969)
-
What file formats can be uploaded into the 3D Warehouse?
- SketchUp ".skp"
- Google Earth ".kmz" (LIDAR Analyst will output KML files - which need to be zipped and renamed to KMZ)
- COLLADA ".dae"
What 3D data types does Google accept?
- Photo-textured 3D buildings in any of the following file formats:
- .shp, .kmz, .skp, .dae, .3ds, .max.
- Non-textured 3D buildings in any of the following file formats:
- .shp, .kmz, .skp, .dae, .3ds, .max.
- Building footprints with heights (extruded or has z-value)
- .shp, .csv, .kmz.(LIDAR Analyst can provide you attributed buildings with z-values in shp as well as KML formats).
In the current version of LIDAR Analyst - features can be exported as kml files. KMZ files - are just zipped kml files. In a future release, you will be able to export features directly to the KMZ file format.
Building footprints (red) shown on top of the hill-shaded last return DEM. Buildings were auto-magically extracted from first and last return DEMs. (LIDAR Analyst is a plugin that works with ArcMAP and Erdas Imagine).
Building footprints exported as a KML file to Google Earth.
Building footprints exported as extruded building models to Google Earth.
Saturday, February 23, 2008
LiDAR Server - serving LIDAR data via the Internet
During the ILMF 2008 conference that was held in Denver, QCoherent released a prototype of a web service that allows users to visualize as well as work with LIDAR data hosted on a central server.
The service which is currently called "LiDAR Server" (http://www.lidarserver.com/) is running off of a 1.3 GHz Celeron D processor and 1GB of RAM machine. LiDAR Server allows the user to visualize LIDAR data using TINS and even allows you to analyze the data using a profile viewer. In addition the service also allows you to extract derivative products from the point cloud - such as contours, TINs, etc.
LidarServer is still a prototype and is sort of clunky - but the concept is truly ground breaking. The idea of hosting of LIDAR data on a central server is not new - USGS Click is one such service. But being able to interact with the data itself and in addition to be able to save derivative products from the original data - is new and I don't think has been done before.
Such a service would be of enormous use to government users - such as cities or the forest service - who might want their data to be available to a wide range of users. It also allows the users of such a service to quickly disseminate their LIDAR data as soon as its available to them. Finally being able to use the data from within a web browser makes the data accessible to even those who don't have a GIS application such as ArcMAP or QTModeller.
My thoughts on improvements to this service:
- Viewer: Currently the view into the data is static. Each click requires the page to be reloaded with a new set of images.
- The interaction with the viewer should be more in tune with Web2.0. It should be dynamic, and data should automatically get cached behind the scenes - so that I can move around in the data just as I would with Google Maps.
- It would be even more awesome if QC would implement their viewer much like Microsoft's Virtual Earth 3D viewer. This would allow one to work with their data in a 3D environment, instead of just a 2d view.
- Web services: The way to go forward in my mind is to actually break this technology into 2 pieces.
- A web page based viewer.
- Actual web services that would allow developers to interact with the data via REST (or SOAP)
Implementing LiDAR Server as these two separate components will then allow other developers to create more plugins based on the web service. The web service would be the key to opening up the data to a myriad other uses. The LIDAR data could then be consumed within applications such as ArcMAP or QTModeller in addition to the web page based viewer for visualization. Applications such as LIDAR Analyst could directly download the data and generate derivative products and upload it back to the server. One might even be able write plugins that will allow for visualization of the data within Virtual Earth or Google Earth.
In addition if the web-service can serve out images (just as it does now), it would be possible to load the data directly into Google Maps (or Google Earth) via image overlay tiles.
LiDAR Server is definitely one of those technologies that makes me exclaim "Now why didn't I think of that!"
LiDAR Server showing an overview of the LIDAR data, an in-depth view of the data as well as a profile of the data.

Subscribe to:
Posts (Atom)