Showing posts with label Scrum. Show all posts

Wednesday, February 01, 2012

Splitting User Stories: Useful resources

Pointed out to me by Mike Schmidt, these are 2 useful documents on Richard Lawrence’s site that show different strategies that can be used to split user stores:

1. Story splitting cheat sheet: http://www.richardlawrence.info/wp-content/uploads/2009/10/Story-Splitting-Cheat-Sheet.pdf

2. Flow chart to aid in splitting of user-stories: http://www.richardlawrence.info/wp-content/uploads/2012/01/Story-Splitting-Flowchart.pdf

image

Saturday, August 13, 2011

Summary: How Microsoft manages development projects using TFS

Came across this slightly old series of posts by the developer division at Microsoft that shows how they used TFS to manage their software development (specifically of Orcas).
  1. Our process
  2. Feature Crews
  3. Planning a release
  4. Tracking Progress
  5. Tracking multiple projects
    1. Addendum
  6. Tracking Risk
  7. Tracking quality gates
  8. Transparency in reporting
Some of the interesting things that I found from the posts:
image_2
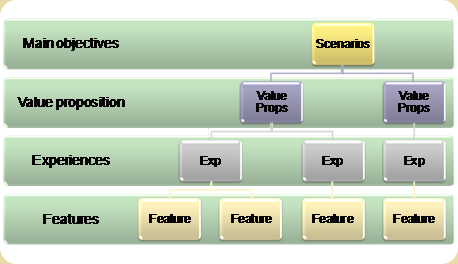
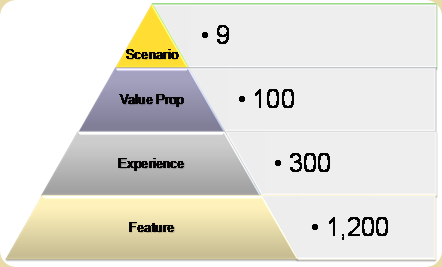
The process involved the planning stages (scenario, value proposition, experience) and the implementation stage (features). The experiences most directly relate to epics. The goal was to break down epics (experiences) into features that could be easily implemented within an iteration (or two). One of the interesting things to note is that how a handful of scenarios can break-down into 1000s of scenarios. (for every epic (experience) there were approximately 4 features).
image_6
Each feature is implemented by a “feature crew”
Development occurs of a branch pulled from the trunk for each feature (Chapter 2)
image_7)
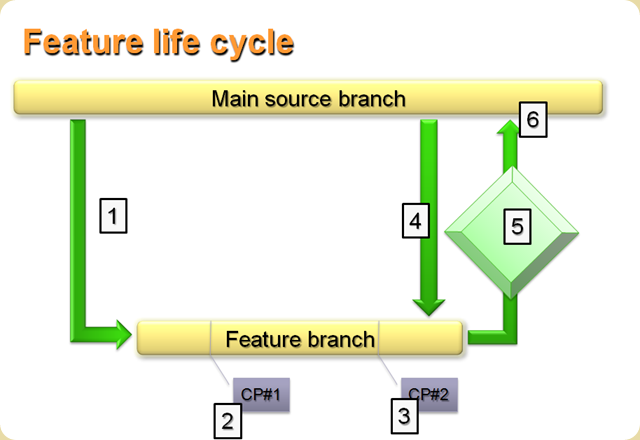
Chapter 2 is extremely interesting as it goes into the lifecycle described by the above diagram.
  1. Branch code.
  2. Checkpoint 1: demo design and get feedback
  3. Checkpoint 2: demo completed functionality
  4. Merge code from main into the branch
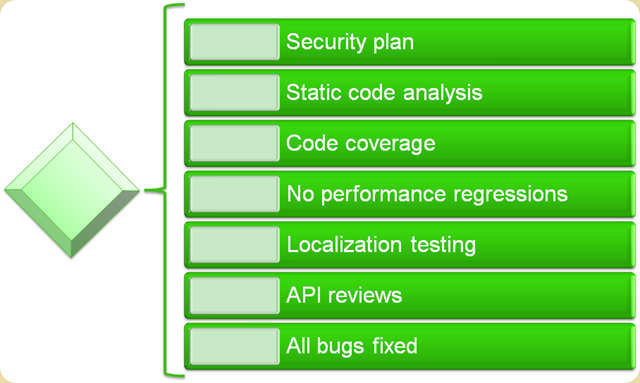
  5. Quality gates: before check-in to main branch can be done, a set of quality gates need to be satisfied
  6. Code is checked in. Because of the quality gates, the quality of the main branch is kept high
Another interesting thing about this chapter is that one of the quality gates was a code-coverage percentage of 70% through automated testing.
Some of the interesting quality gate categories used were:
image_8
Chapter 4 discusses how features were assigned “ball-park” estimates. Estimates for all features were aggregated into a single excel work-book which was then used to determine the order in which features were to be implemented.
In chapter 5, the post discusses about how TFS allowed the different feature teams to use whatever development model that suited them (Agile, Waterfall, etc). Communication of the state of the feature implementation was done via a single tab in TFS that needed to be updated once per week. The tab itself is minimal in the amount of information it collects. (looks like the dev-div used a custom template and the post describes the Progress tab in detail). There were 4 dates that were key during a feature implementation. All dates did not have to be committed to at the beginning of the feature implementation project. Instead the process followed was:
At the start of the feature crew, the team needed to commit to a checkpoint 1 date, and estimate the checkpoint 2 and finish dates. At checkpoint 1, the team would commit to a checkpoint 2 date, and estimate the finish date. At checkpoint 2, they would commit to a finish date.
Another interesting item tracked was the risk. This was tracked via 3 codes: green, yellow and red
Green = We will meet the dates
Yellow = We are at risk
Red = We will miss the dates
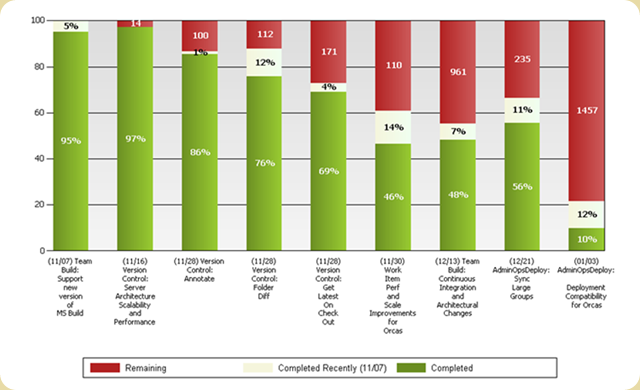
Tracking of multiple projects (chapter 6) was done via reports generated of off TFS. This report was used in a weekly meeting of feature team managers, the program manager and product manager. The report presented all features that were currently in flight. This was done using a red, yellow, green report that showed:
  • Green - The percentage of work completed, when compared to the entire project
  • Yellow - The percentage of work completed in the last reporting period, typically 1 week.
  • Red - The number of hours of work remaining.
  • You'll also note that the date the feature crew is scheduled to complete is included with the name of the feature crew.
image_9
An interesting thing to note in this post is the culture shift that occurred by the transparency that occurred with data that was available up and down the chain regarding project status:
In this culture of openness, management had to let go of "holding people to their original dates, no matter what" and those on the feature crew had to let go of "presenting the project status in the best possible light" or "hiding bad news".
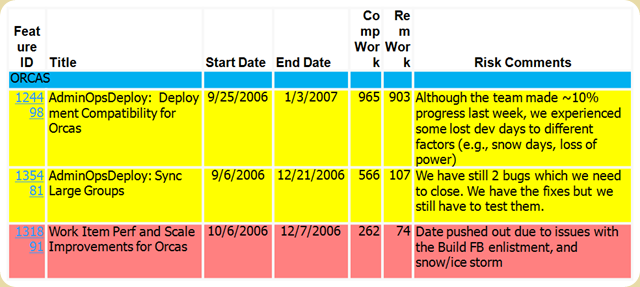
Chapter 7 discusses the risk information that is entered into the Progress tab that was discussed earlier in chapter 5. The risk information is pulled into an excel report and all those teams that are not green need to explain why the progress tab as well as in a weekly meeting as to why the team maybe slipping. Again an interesting part about this post is that the division was making the mind shift to transparency, where it was better to let the team know early than latter that you were going to be late. The team itself realized that sometimes slips occurred because of issues that were out of the control of the team.
image_8
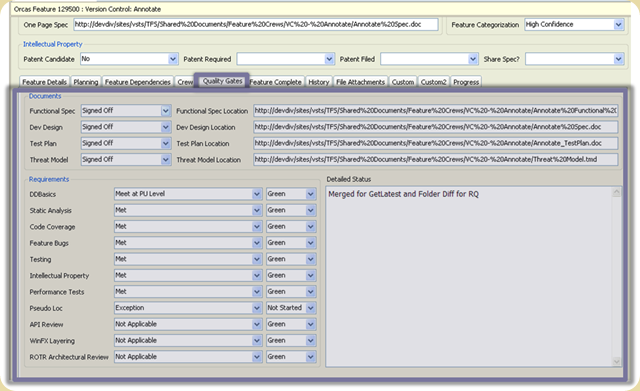
Quality gate tracking is discussed in Chapter 8. The tracking itself is done via the Quality Gates tab in TFS.
image_2 (1)
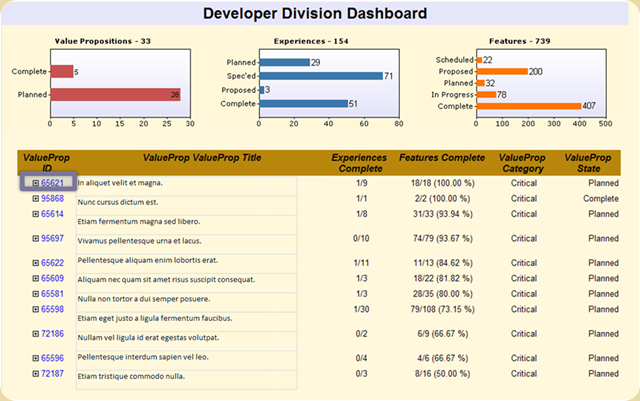
The final chapter (Chapter 9) shows the reports that was used by the top management to keep track of the progress that was being made across scenarios, value proposition, experiences and features. (basically a drill-down report).
image_2 (2)
The entire series is an extremely good read and I strongly suggest that you read them (as what I have done here is to only summarize the series, mainly so that I would have them all in one location). Thanks to Greg Boer for doing an excellent job of documenting how TFS was being used within the dev-division at Microsoft.
More info:
Ever Wonder How We Build Software at Microsoft? Now You Can Read All About It!

Thursday, August 04, 2011

Task estimation on Agile Projects

imageTypically I have used the planning poker estimation sequence when performing task estimation (1,2,3,5,8,13). Here the numbers represent hours instead of story-points as they normally do during User-Story estimation. We used a cut-off of 13, the number of hours above which we think the task should be broken down. The basic idea behind it was that using the planning poker sequence for the number of hours a task would take, provided a buffer to the estimates.

Recently we had a discussion at work on whether tasks should be estimated in just plain hours as estimated by the developers, or whether we should use the planning poker sequence to drive the number of hours estimate.

imageThe first thing to realize: its important to use different units for your user-story estimates vs. task estimates. This is accomplished by using story-points for user-stories and hours for estimates. This is useful because story-points are an abstract entity, making it easier to realize that the story-points are trying to capture not just effort, but also complexity and risk. In addition, it makes you also realize that story-points (as opposed to another unit like ideal hours) cannot be directly converted to number of hours that the user-story will take (although one can estimate this after a few sprints have passed and we have a team sprint velocity metric).

Back to the topic on hand: Based on research I have done, I am now a convert to using just plain hours for the task estimates (instead of using the planning poker sequence). Here is why:

  • User stories are large, complex and have a lot of uncertainty and risk. They are harder to estimate. Hence we use the planning poker sequence to reiterate the fact that there is probably going to be a magnitude of difference in the amount of work/time it will take to complete the user-story.
  • Tasks are how user-stories are broken down when it comes time to implement a user-story. An important point to remember is that a 3 hour task and an 5 hour task are not different by an order of magnitude, which is what the story-points reflect. Instead, the 2 tasks are different by 2 hours and that’s all there is to it. In addition, it is perfectly alright to have a task that would take 4 hours.  By sprint planning stage, the risk and complexity associated with a user-story should be known. In addition, tasks are typically items that the developers know about and can estimate well. Finally, the number of tasks that need to be estimated are normally small because they are done for the current sprint (where the sprints typically last from 1 to 4 weeks – smaller the better). Because of the shorter time horizon on tasks, one shouldn’t have to pad the estimates for tasks. Hence, one shouldn’t have to use the planning poker sequence, and should just use the actual time estimate for that task.

Remember, based on the cone of uncertainty: Story points are useful for long-term estimation. Hours are better for short-term estimation.

Some other notes:

Task estimation should still be done by involving all the team-members. The user-story should be broken down into tasks and estimates should be presented by all team-members at the same time (just as one would do during a planning poker session). Any differences in estimates should be discussed and a consensus estimate in number of hours for the task should be arrived at. (This in my mind is a modified wide-band delphi estimation technique).

Normally, I have done sprint-planning in two separate sessions:

session 1: break down the user-story into tasks

session 2: generate estimates for the tasks.

Its important to also realize that an estimate is not the same as a commitment to deliver (i.e., an estimate of 8 hours for a task is not the same as committing to deliver the work in 8 hours). Hence the commitment session should be separated from the estimation session. The team commits to what it believes it can deliver within a sprint, given the estimates of all the tasks, other work that the team needs to do and other factors.

Its interesting to note that in the 2011 Scrum Update, the following is said (further validating the fact that estimates are not commitments):

Development Teams do not commit to completing the work planned during a Sprint Planning Meeting. The Development Team creates a forecast of work it believes will be done, but that forecast will change as more becomes known throughout the Sprint.

Comments by Geoffrey Corey (Agile mentor):

User stories are still abstract things and should be story pointed. Planning poker and relative estimating with a benchmark story are two ways to do that. The purpose for the story points is to prioritize and identify high risk or nebulous stories that either are broken down or are candidates for a spike solution. Once the stories are sized and prioritized then a time box (sprint) can be set and based on sprint velocity user stories can be added. At that point it is useful to break down just those stories in the sprint into tasks.  

I totally agree that tasks should be done in hours, not story points. You can then add up the task hours and build a chart showing Story | Story Point | Total # of task hours.   This will show you if your story point estimates are in line with task estimates.   For example,  you many have around 20 hours of tasks to do for a 5 point story.   If you are within +/- 4 it appears you were consistent in story point estimates for all the 5 point stories.   If you have on 5 pt story that is 60 hours of tasks, then you might want to pop the flare early before the sprint and inspect what went wrong and if you should repackage the sprint.

Velocity is still done by story points.    Task estimation is just a validation of the planning poker estimate.

User story to task validation chart:


Story

Story Point

Total # of task hours

1

as a user I would like to pay using a credit card

5

25

2

as a user I would like to pay using a debit card

5

23

3

as a user I would like to register my account

3

15

4

as user I would like to login using Facebook Connect

3

25

5

as user I would like to reset my password

5

15

* the 3rd story probably has a bad story point estimate. the same is probably true for story 5.

References:

  1. Task estimation: Do or don’t? http://www.agilejournal.com/articles/columns/column-articles/1232-task-estimation-do-or-dont
  2. Are you using planning poker for estimating tasks? Maybe you should reconsider it… http://geeks.ms/blogs/jlsoria/archive/2011/05/19/are-you-using-planning-poker-for-estimating-tasks-maybe-you-should-reconsider-it.aspx
  3. Sprint and release planning should be in different units: http://blog.mountaingoatsoftware.com/sprint-and-release-planning-should-be-in-different-units
  4. Why I don’t use Story Points for Sprint Planning: http://blog.mountaingoatsoftware.com/why-i-dont-use-story-points-for-sprint-planning
  5. Separate estimating from committing: http://blog.mountaingoatsoftware.com/separate-estimating-from-committing 
  6. Agile estimation and the cone of uncertainty: http://agile101.net/2009/08/18/agile-estimation-and-the-cone-of-uncertainty/
  7. How to implement Scrum in 10 easy steps: http://www.allaboutagile.com/how-to-implement-scrum-in-10-easy-steps/
  8. Wideband Delphi: http://en.wikipedia.org/wiki/Wideband_delphi

Wednesday, June 22, 2011

Story-pointing using relative sizing

Using the Sticky-Notes application in Windows 7 makes it easy for every one to see and also works out great when you have multiple teams offsite, that are using screen-sharing to take part in the planning session.
Below is a picture of one such session, where we were using a projector to display the relative sizes locally and an offsite team was viewing the same screen using Mikogo.
image

Also checkout my previous post on using sticky-notes for story-point estimation: http://blog.aggregatedintelligence.com/2011/05/estimating-user-storiesallowing-team-to.html

Incorporating feedback within Scrum

Came across this nice graphic that shows how feedback from customers is incorporated into the Scrum cycle.

scrum_feedback

BHarry discusses it in more detail at: http://blogs.msdn.com/b/bharry/archive/2011/06/21/the-importance-of-feedback-in-software-development.aspx

Friday, May 06, 2011

Collaboration while estimating stories

Normally, I have used sticky notes and a wall to estimate user stories. (Put the stories on the wall in the different story point columns).

The problem that I have always had with this approach is that sticky notes are SMALL and if you have a big team, you either end up with a crowd around the board, or people continuously walking up to the board. Its always been disruptive to the estimation meeting having people swarm up to the board.

from: http://www.xqa.com.ar/visualmanagement/2009/04/daily-scrum-against-the-board/

There are a number of open-source and free tools out there that might allow you to do it on a computer.

But today I saw one of our business-analysts use a simple but ingenious ideas. She used a Windows 7 widget called “Sticky Notes”.

First she created Sticky Notes for the story point columns: 1, 2, 3, 5, 8, 13….. Next she created a pile of sticky notes with the user-story title on them. Then she pulled one from the sticky note pile and we estimated it. Upon estimating the user-story, she stuck the sticky note under the correct user-story column.

Simple, indigenous and provides visibility to the entire agile team in the room.

Here is what it looked like at the end of the estimation session:

image

Important: The above is not the task-board. It does not represent the tasks that are planned, in progress, done, etc. It’s a board that allows for estimation of stories and being able to have a sense of what your stories assigned to a certain story-point look like. In my mind this makes it easier to have uniformity in the stories and the story points that they are assigned.

Thursday, April 28, 2011

Tasks and the Smart Model

In a previous post I wrote about User Stories and Invest Model.

Here is a SMART model to use to determine if you have good tasks for your user stories or not:

A good task should be:

S Specific
M Measurable
A Achievable
R Relevant
T Time-boxed
   
http://xp123.com/articles/invest-in-good-stories-and-smart-tasks/

User Stories and Invest Model

Is your user-story a good one? Use the INVEST Model as one factor in deciding if it is:

I Independent
N Negotiable
V Valuable
E Estimatable
S Small
T Testable

http://xp123.com/articles/invest-in-good-stories-and-smart-tasks/

Thursday, April 07, 2011

Example of a good user story

From: http://dannorth.net/whats-in-a-story/

A story should have a title, a narrative and a set of acceptance criteria presented as scenarios.

Title (one line describing the story)

Narrative:
As a [role]
I want [feature]
So that [benefit]

Acceptance Criteria: (presented as Scenarios)

Scenario 1: Title
Given [context]
And [some more context]...
When [event]
Then [outcome]
And [another outcome]...

And here is an example presented by the author in his post:

Story: Account Holder withdraws cash

As an Account Holder I want to withdraw cash from an ATM, so that I can get money when the bank is closed

Scenario 1: Account has sufficient funds
Given the account balance is $100
And the card is valid
And the machine contains enough money
When the Account Holder requests $20
Then the ATM should dispense $20
And the account balance should be $80
And the card should be returned

Scenario 2: Account has insufficient funds
Given the account balance is $10
And the card is valid
And the machine contains enough money
When the Account Holder requests $20
Then the ATM should not dispense any money
And the ATM should say there are insufficient funds
And the account balance should be $20
And the card should be returned

Scenario 3: Card has been disabled
Given the card is disabled
When the Account Holder requests $20
Then the ATM should retain the card
And the ATM should say the card has been retained

Scenario 4: The ATM has insufficient funds
...

Wednesday, September 22, 2010

The changing workspace of the software developer

Out: Cubicles, partitions

In: Team rooms, open spaces

Recently, I was trying to research how the workspace of the software developer was changing and how successful companies are setting up the space for their developers.

Here are some pictures that show the changing space:

Also, came across this article which has tons of information on Team Rooms: http://www.possibility.com/Cpp/SoftDevOfficeLayout.html

Thursday, May 06, 2010

Sample User Story - Scrum

User Stories are an important component of any Agile project. Here is a sample one (from the agile alliance):

Title: Search for providers by provider specialty.
Description:

As a provider search user, I need the ability to search for providers by specialty so that I can more efficiently refer patients to specialists.
Acceptance criteria:
The provider search mechanism has the ability to enter a specialty.
The specialty search will have a list of provider specialties from which to select.
Searching via the provider specialty will return a list of matching specialists or a message indicating that there are no matches.
If there are more results than can fit on one page, the system will provide the capability to view the list in pages or sections.

Monday, August 17, 2009

Scrum for TFS (Concango Template)

Do you get the “No data available yet.” message when you try and view your Sprint View reports?

Make sure that the Sprint Start Date and End Date are set.

image

Thursday, June 04, 2009

Scrum on a page

From a Neudesic seminar “Introduction to Agile”

image

http://www.neudesic.com/insight/Presentation/Pages/PW20090326.aspx

Scrum cartoon – story of the pig and the chicken

This story was referenced in a TFS seminar today.

060911-scrumtoon

Here is an easy definition of the Chickens versus Pigs.

A Pig is someone who has skin in the game. Pig roles are considered core team members.

A Chicken is someone who has something to gain by the Pigs performing, but in the end, really do not contribute day to day to “getting things done.” Their “eggs” are a renewable resource, and numerous.

Read more at The Classic Story of the Pig and Chicken.

Tuesday, May 19, 2009

Scrum – Cheapest Planning Poker Cards

These are the cheapest planning poker cards that I have come across ($2.50 per deck – which 4 people can use).

http://store.mountaingoatsoftware.com/products/planning-poker-cards

image 

Want it cheaper – print your own:

http://www.agile-swiss.org/wiki/images/6/6f/PokerPlanningCards1Front.pdf  (page 1)
http://www.agile-swiss.org/wiki/images/a/ad/PokerPlanningCards2Front.pdf (page 2)

And here is one more set in PDF format that you can print:

Page 1
Page 2

Want to be eco-friendly? then try this online version: http://www.planningpoker.com/